We’re excited to share that we’ve made some updates and refinements to the Retention Report in PracticeVital! We wanted to make it easier for you to track retention trends over time and see how variations in intake numbers impact your retention rate. We hope our new updates give you a more dynamic and insightful view into your practice’s performance.
What's new in the report?
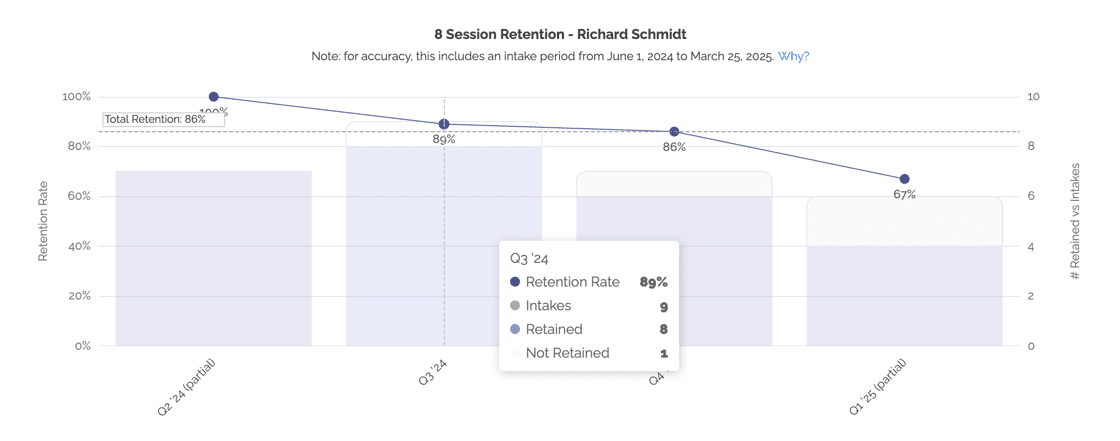
See Retention Trends: Before, you could only see overall retention for clients who started during a specific time period. But it was hard to tell whether things were getting better, worse, or staying the same over time. Now, you can track retention quarter by quarter or month to month to see if a clinician is improving and if your interventions are working.
More Clarity in the Retention Report:
We’ve added more helpful numbers to the main Retention Report chart so you’re not just looking at a percentage. Now you’ll also see:
How many new clients started (intakes)
How many were retained (met your session threshold)
How many weren’t retained
This makes it easier to understand the full picture—especially when intake numbers change from month to month.
More Ways to Filter the Data: You can now break down the Retention Report just like you can with other PracticeVital reports. That means you can look at:
Your whole practice
Groups like location, supervisor team, or type
Each individual clinician over time
It’s easier than ever to dig into what’s working and where there’s room to improve.
To help you get started, we’ve created a quick video walkthrough of the new Retention Report. And please reach out to support@practicevital.com with any questions or comments.
We’d love to hear your thoughts on this update! Your feedback helps us continue to improve PracticeVital. Thank you for being part of the PracticeVital community!